 PSRCHIVE
| Ask a Question | Search PSRCHIVE: |
 PSRCHIVE
| Ask a Question | Search PSRCHIVE: |
 Home Home
|
Pulsar::FluxPlot Class Referenceabstract Plots flux profiles. More...
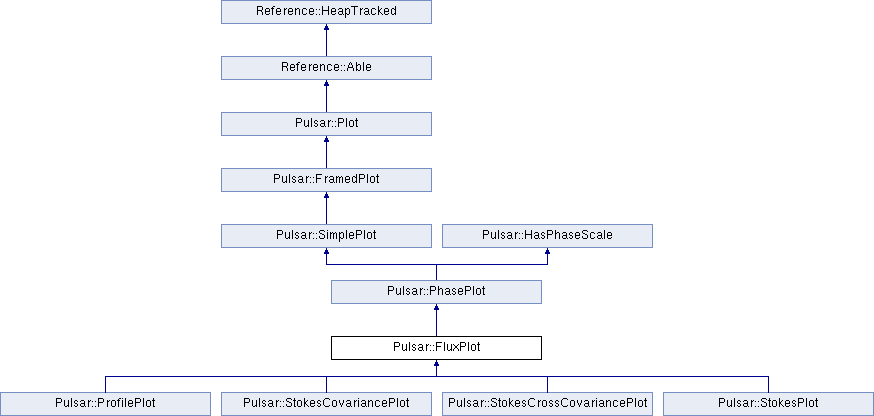
Inheritance diagram for Pulsar::FluxPlot:

Detailed DescriptionPlots flux profiles. Member Function Documentation◆ auto_scale_phase()
Automatically scale in on the on-pulse region. Scale in on the on-pulse region. References Pulsar::Profile::find_peak_edges(), Pulsar::FramedPlot::get_frame(), Pulsar::ProfileAmps::get_nbin(), and Pulsar::PhasePlot::get_scale(). Referenced by prepare(). ◆ draw()
Draw the profiles in the currently open window. The ProfileVectorPlotter class draws the profile Implements Pulsar::SimplePlot. Reimplemented in ProfilePlot, and Pulsar::ProfilePlot. References Pulsar::FramedPlot::get_frame(), Pulsar::PhasePlot::get_scale(), and plot_error_box(). Referenced by Pulsar::ProfilePlot::draw(). ◆ get_interface()
Return the text interface. Implements Pulsar::Plot. Reimplemented in ProfilePlot, Pulsar::ProfilePlot, Pulsar::StokesCovariancePlot, Pulsar::StokesCrossCovariancePlot, and Pulsar::StokesPlot. ◆ get_profiles()
Derived classes must provide the profiles. Implemented in ProfilePlot, Pulsar::ProfilePlot, Pulsar::StokesCovariancePlot, Pulsar::StokesCrossCovariancePlot, and Pulsar::StokesPlot. Referenced by prepare(). ◆ get_ylabel()
Get the default label for the y axis. Return the label for the y-axis. Reimplemented from Pulsar::SimplePlot. References Pulsar::Archive::get_scale(), and Signal::Jansky. ◆ plot_profile()
Draw a profile in the currently open window. This method sets the viewport (cpgsvp) and window (cpgswin) dimensions, but does not draw the axes or label the frame. To draw the axes, cpgbox must be called after this method. The ProfileVectorPlotter class draws the profile References Pulsar::FramedPlot::get_frame(), Pulsar::ProfileAmps::get_nbin(), Pulsar::PhasePlot::get_scale(), and Pulsar::PhaseWeight::resize(). ◆ prepare()
Perform any preprocessing steps. The ProfileVectorPlotter class computes the minimum and maximum values to be plotted Reimplemented from Pulsar::FramedPlot. References auto_scale_phase(), Pulsar::FramedPlot::frame, get_flux_maximum(), Pulsar::FramedPlot::get_frame(), get_profiles(), Pulsar::PhaseWeight::get_rms(), Pulsar::Archive::get_strategy(), Estimate< typename T, typename U >::get_value(), and Pulsar::ProfileWeightFunction::operate(). ◆ set_original_nchan()
Set the original number of frequency channels. This attribute is used in the get_phase_error method to determine the dispersion smearing across each channel The documentation for this class was generated from the following files:
Generated using doxygen 1.14.0
|
|||||||||||||||||||||||||||||||||||||||||||||||||||||||||||||||||||||||||||||||||||||||||||||||||||||||||||||||||||||||||||||||||||||||||||||||||||||||||||||||||||||||||||||||||||||||||||||||||||||||||||||||||||||||||||||||||||||||||||||||||||||||||||||||||||||||||||||||||||||||||||||||||||||||||||||||||||||||||||||||||||||||||||||||||||||||||||||||||||||||||||||||||||||||||||||